

Meet the Google Analytics 4 (GA4) property! With innovative features and improved flexibility, Google claims this experience “is the future of Analytics”. In October 2020, Google introduced Google Analytics 4 as the new default analytics property and the replacement for Universal Analytics (UA). GA4 will completely replace UA in July 2023.
But don’t wait to switch! Ensure there is no loss in valuable analytical data and tackle the uphill battle of learning a new interface sooner rather than later.
While it comes with a learning curve, it’s important to understand they key differences and recognize the benefits of the upgraded analytics platform.
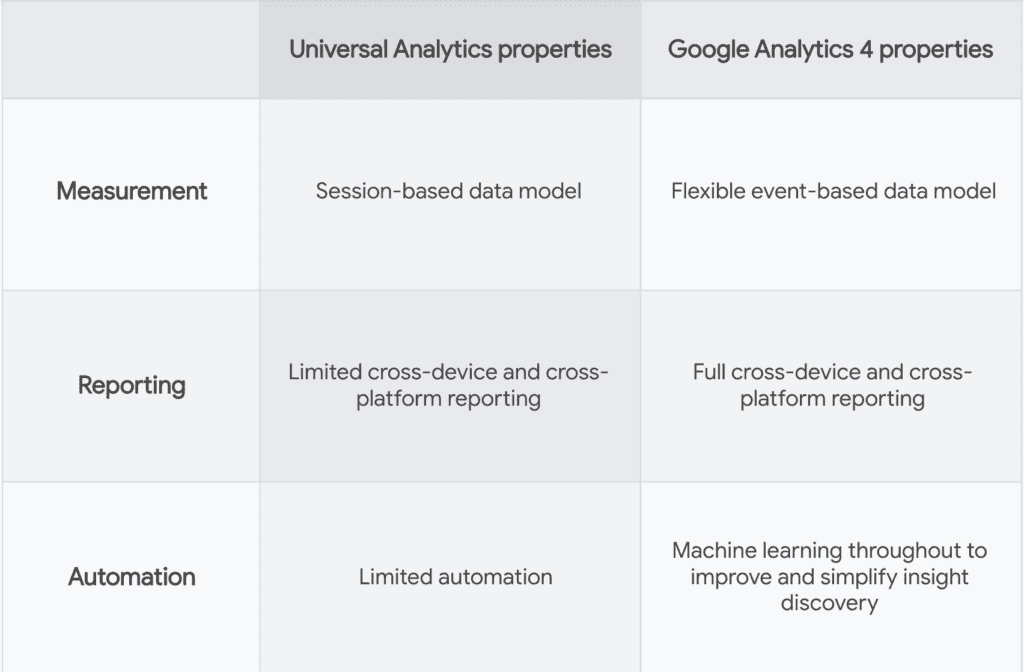
Google Analytics 4 vs. Universal Analytics
Whether you’re new to Google Analytics or you’re an Analytics pro, it’s important to understand the features of GA4 how they compare to UA properties and features.
Sessions vs. Events
Sessions are gone – that was so UA! In GA4, you can still see session data, but user interactions with your website or app are now stored as events. Events provide insight on what’s happening in your website or app, such as pageviews, first visits, video views, or clicks.
Events collect and send pieces of information that more directly specify the action the user took. This information could include things like the name of a white paper a user downloaded, the title of the page a user visited, or the geographic location of the user.
By moving to event-based collection, Analytics is more flexible, scalable, and is able to perform more custom calculations faster!
Need to create an event? Check out this event video tutorial from Google.

Pro Tip: Enable the enhanced measurement feature, an option that lets you automatically collect more events without having to update your website’s code.
Benefits of Google Analytics 4:
- Scales with your business
- Adapts to a changing environment
- Reveals intelligent business insights
- Helps you achieve your marketing goals
- Integrated reporting*

*Integrated reporting is a big upgrade! Users often switch devices or profiles as they interact with your website. GA4 can de-duplicate users across data from different devices. This means you can measure a single user journey across devices!
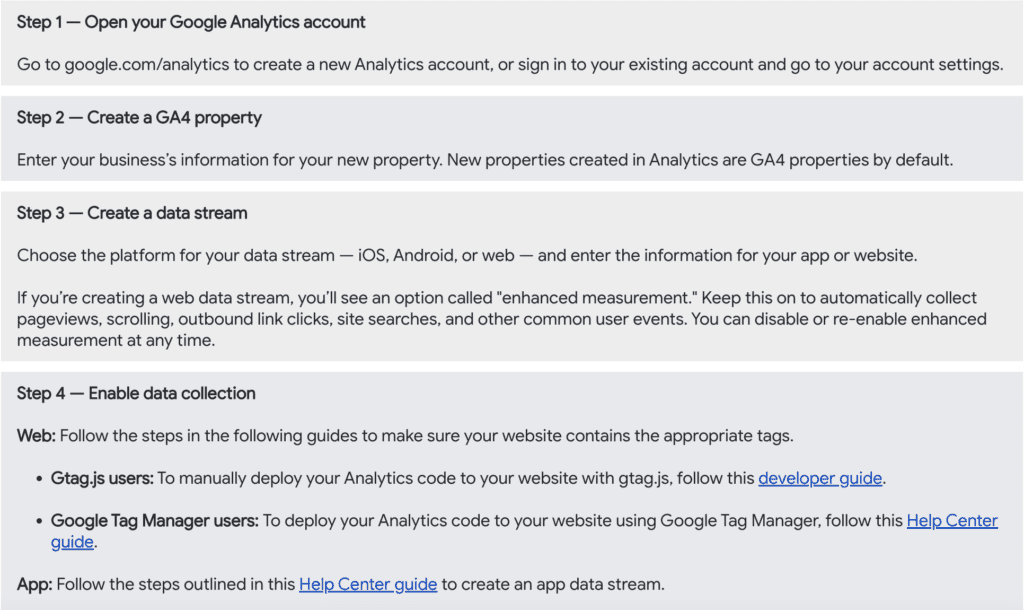
How To Set Up Google Analytics 4
What To Do If You Already Use Google Analytics?
Already using Universal Analytics for your website? Awesome! You can set up a new GA4 property and continue to use your existing UA property until July 2023. We recommend setting up and starting to use GA4 properties alongside your existing UA properties right away! This way, you can begin collecting data in this property for the future.
Google Analytics 4 Reporting
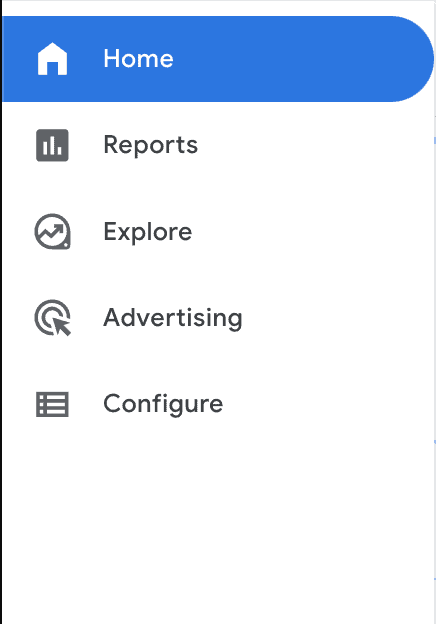
In GA4 properties, reporting is now simplified. Instead of a long list of predefined reports, such as ‘Site Speed’ and ‘Site Search,’ now, a handful of overview reports each cover a single insight about your business in a summary card.
You’ll find these reports listed on the left side of the Analytics interface, such as Aquisition and Engagement. Each report shows a high-level snapshot of these insights using summary cards. If you want to go deeper into the data, explore a more comprehensive report by selecting the link at the bottom of each summary card!
With the ‘Realtime report’, you can monitor activity as it happens. This report shows you events that took place between five seconds and 30 minutes ago.
If you’re looking for insights that the reports don’t cover, the Explore section gives you more customizable ways to analyze your data. With Explorations, you can easily filter, segment, sort, and customize the dimensions and metrics you’re interested in to home in on the insights you care about.
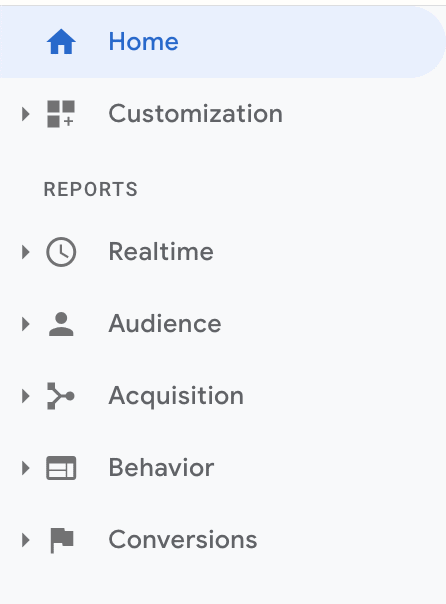
UA vs. Google Analytics 4 Navigation
Custom Reporting in GA4
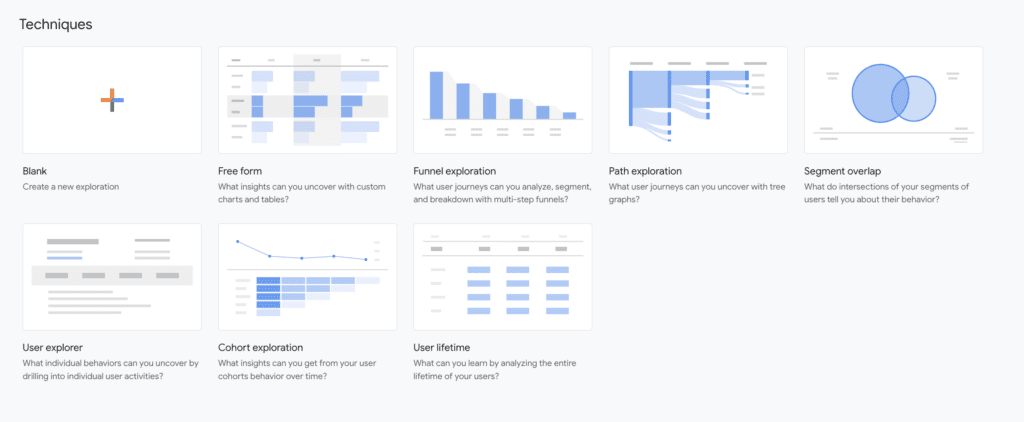
In Explorations, you’ll see a few different custom report options:
- Free Form
- Create Your Own! The free form exploration allows you to visualize your data with flexibility and ease.
- Funnel Exploration
- Funnel exploration lets you visualize the steps your users take toward a key task or conversion. This can help your team identify sequences of key events and understand how your users navigate these steps.
- Path Exploration
- Path exploration lets you understand how people progress from one stage in the customer journey to the next. While funnel exploration only analyzes a single, predefined path, path exploration is free-flowing and can follow any number of undefined paths – even ones you weren’t aware of!
- Segment Overlap
- Segment overlap lets you compare up to three user segments to quickly see how those segments overlap and relate to each other.
- User Exploration
- User exploration lets you select specific groups of users and learn more about each anonymous individual user’s activities. This can help your team personalize the user experience or gain insight into user behaviors.
- Cohort Exploration
- A cohort is a group of users who share a common characteristic identified in this report by a specific event the user has triggered. For example, all users who downloaded a white paper this week belong to the same cohort. Now you can explore behavior of these groups over time!

Explore GA4 Report Snapshot

Ready to jump in and explore on your own? Practice with the Analytics Demo Account!
Google allows users to get familiar with Analytics by exploring Google Analytics through a demo account. Once you gain access, you can explore through guided tours of the different features using fully functioning Analytics properties. Don’t worry, you won’t break anything!
Would you rather have a team handle your analytics and reporting? We get it. Seventh Scout is Google Analytics Certified and here for you! We use Google Analytics to uncover opportunities for our clients and provide recommendations for further optimization and continuous improvement. Learn more about our strategy and analytics services.